Special Issue - eMagazine
Introduction
Built Environment casts substantial impact on natural environment and interacts with it in several ways. Throughout its life cycle from pre-construction phase to deconstruction phase, built environment consumes resources in the form of energy, water, materials; emit wastes which are detrimental to natural environment and living species. As estimated by past studies, human species will require another earth by 2050, if, the present rate of consumption of natural resources continues. A Study conducted by World Wildlife Fund (WWF) in 2002, with 1970 as baseline year, reported that the Living Planet Index fell from 100 to 65, earth’s forest cover shrunk by 12%, freshwater bio-diversity by 33% and freshwater ecosystems by about 50% in a span of one generation. Report published by International Geosphere-Biosphere Program (IGBP), 2010, observes that nearly 50% of the available land surface is transformed due to human intervention and global energy consumption increased by 84%. Demographic projections estimate population growth to touch 9 billion by 2050 and will aggravate existing problems such as resource depletion and global warming, as per UNEP, 2009 report.
Global Scenario
Studies carried out by Organisation for Economic cooperation and Development (OECD), Paris, 2011, observed the rate of global material consumption to be 62 billion tonnes per year and expected to reach 100 billion tonnes by 2030. This increase in material consumption is largely due to escalation in global demand by three groups namely, construction, energy and metal. Cumulatively, these three groups account for about 80% of the total material extraction resulting in supply-demand chain imbalance,Climate Change 2014-Impacts.
Increase in population, energy production and consumption are intricately connected. Energy use also contributes to greenhouse gas emissions. As per World Energy statistics, global total of coal production in 2015 was in the order of about 7700 Million tonnes. Out of this, China and India contribute 46% and 9% respectively. It is also estimated that world total primary energy supply increased from 6100 Mtoe (Million tonne oil equivalent) in 1973 to 13700 Mtoe in 2014 indicating an increase by 2.25 times. Out of the total electricity produced in the world using coal, which is in the order of 9700 TWh as per IEA report (2016), 70% is taken away by USA, China and India together. Current global Carbon dioxide emissions due to fuel consumption alone, estimated to be in the order of 32380 Mt of CO2. It is interesting to note that the world CO2 emissions will come down to 18777 Mt of CO2 by 2040 if climate policies framed during the recently concluded COP-21, Paris, 2015 summit are strictly enforced. Primarily, the framework of COP-21 limits greenhouse gas (GHG) emissions to 450-ppm CO2 equivalent. As per 2014 IEA data, India is responsible for 2019 Mt of CO2 emissions out of 32380 Mt of CO2.
‘Trends in global CO2 emissions’, report generated by Environmental Assessment Agency, PBL-Planbureau Voor De Leefomgeving, Netherlands, 2015, estimate India, USA, China and EU cumulatively contribute to the global carbon dioxide emissions in the order of 61% and out of which, India’s contribution is about 6.5%. According to World Health Organisation, majority people live in urban areas by 2030. The global urban population is expected to grow at 1.44% per annum between 2025 and 2030. This growth in population mounts colossal pressure on infrastructure development resulting in sustainability imbalance. Infrastructure development necessitates large amounts of materials and energy from material extraction stage till deconstruction stage. This entire process entails in waste generation, pollution and depletion of non-renewable resources calling for immediate implementation of remedial measures. Charles Kibert, 2007, observes, two fifths of world’s energy flow and material are due to buildings.
From sustainability viewpoint, considerable restraints are required to reduce consumption of non-renewable resources such as minerals and fossil fuels. Nature provides these resources through slow geological processes. Unscrupulous use of these resources diminishes available stocks leading to crossing over of critical thresholds provided by nature. Studies carried out by National Institute for Public Health and Environment, Netherlands, 2015, have shown that, worldwide demand for fossil and mineral resources are continuing to grow at rapid pace. Unavoidable industrial growth in developing countries has also added to this demand. Use of raw materials by built-environment is directly proportional to natural resources consumption. IPCC- Intergovernmental Panel on Climate Change, 2001, observes building sector to be responsible for 25% of global carbon dioxide emissions and 40% of global energy consumption. It is appropriate to evoke United Nation’s call for evolving suitable sustainability development indicators by each country that assist and improve decision making at all levels (UNCED, 1992; Agenda 21, Chapter 40).
Indian Scenario
India, with about 1295 million estimated population in 2014, stands as the second most populous country in the world and has to take care of its infrastructure demands including housing almost on a continuous basis. Indian Government has promised to provide housing for all by 2022. This amounts to building about 20 million houses in the next five years. Mega policy decisions like these are bound to exert enormous pressure on natural material resources and environment. As per Indo-German consortium report, it is estimated that India consumes about 7% of the total global material extraction amounting to 4.6 billion metric tons and expected to reach 27 billion metric tons by 2050. At present, average material consumption per capita per annum by India is about 4.2 tons and likely to touch 9.6 tons by 2030.
It is estimated that approximately 32% of the total Indian population lives in urban areas and this number will reach 50% by 2030. As per United Nations Environmental Program (UNEP) report, 2011, 66 million households were in urban areas in 2010 and projected to be doubled by 2050. Expected growth in commercial building spaces will also swell from 200 million sqm in 2009 to 890 million sqm by 2030. Indian construction sector is in growth mode currently and contributes about 22% greenhouse gas emissions in India. Studies have shown that energy demand during construction phase is mainly due to embodied energy of construction materials and quantification of energy consumption during construction phase is a complex phenomenon. To resolve this complexity there is a need to control and prudently use natural resources to shrink the carbon foot print. Hence, realistic assessment of energy impact of buildings attains greater importance all over the world in general and more so in developing countries like India.
In developing countries like India, migration pressure from rural areas to urban areas is also substantial. Demographic projections as per Indian census, 2011, the urbanization pattern is restricted to few cities leading to construction of high-rise buildings. High-rise buildings can yield large floor areas on small pieces of land. Optimum utilization of land, energy and natural resources then become governing factors for high rise buildings. With the advanced design and construction technologies available and the demand for real estate soaring, high rise buildings provide a better solution in terms of living conditions at affordable pricing. Economic Survey of India report, 2015-16, indicates shortage of about 20 million residential units. In urban scenario, economically weaker sections and lower income groups together constitute for 95% of the urban housing shortage in the country.
Planetary Boundaries
Human induced impact on limited planetary resources is unmatched. It is the collision between exploding population, growing economy and the limited natural resources, provided by the planet; results in the imbalance of entire eco-system. Quantification of major challenges stemming out from this human induced impact is a complex phenomenon and so are the solutions associated with sustainability assessment. Figure 1.1 offers visualisation of ten critical planetary boundaries that humanity is in danger of exceeding. The yellow shaded area in the chart provides an indication as to how close the world is in exceeding each of these boundaries. For example, in case of nitrogen cycle and bio-diversity loss, the entire wedge of the chart is yellow indicating the fact that humanity has already crossed the limits. In case of climate change, humanity is rapidly pacing towards the danger limit. Thus, it can be observed from the chart that humanity is already rushing the planetary boundaries beyond its limits.
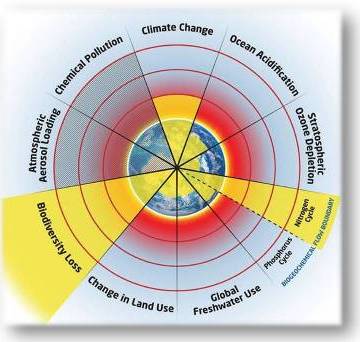
Figure : Planetary Boundaries
(Source: A safe operating space for Humanity, Macmillan Publishers, 2009)